


[Mint Daily Wrap 10/Jul] Tariffs Tighten, Valuations Soar, and the Global Market Narrative Fractures
A sweeping look at how rising trade frictions, macro shifts, and valuation extremes are reshaping global markets.


Global trade tensions and looming tariffs drag Japanese and U.S. markets into uncertainty.
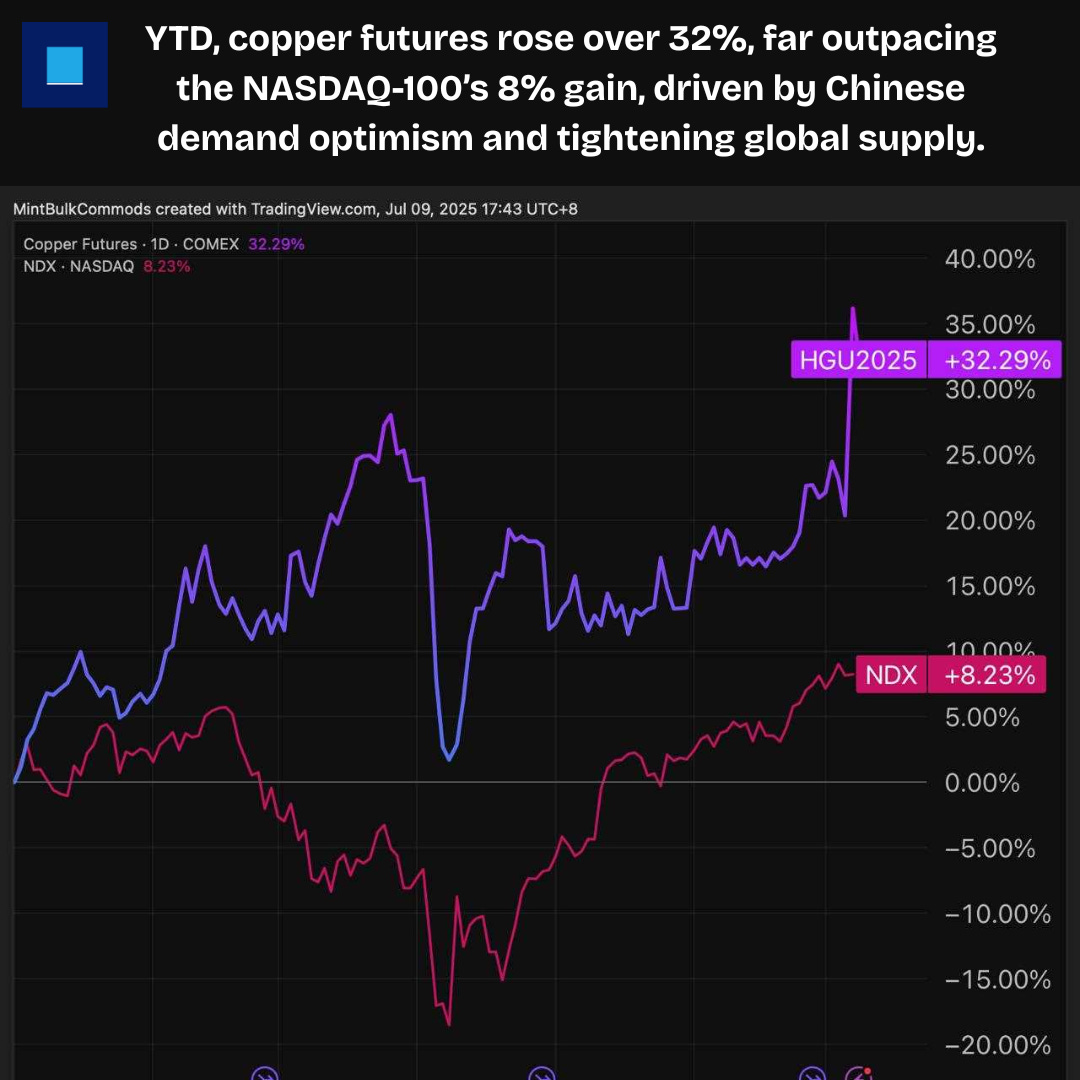
Commodities diverge as copper, gold, and iron ore rally while crude slips on swelling stockpiles.
The Buffett Indicator reached 208%, flashing a red warning on equity valuations amid surging AI optimism.
SUMMARY MARKET ACTION

Japanese Stocks Falter as Tariff Threats and Growth Woes Loom
Japanese equities ended lower on Thursday as the adverse impact of ongoing trade tensions with the US resurfaced. The newly proposed 25% retaliatory tariff on Japanese goods could shave 0.8% off Japan’s GDP in 2025, according to estimates by the Daiwa Institute of Research. The economic blow could deepen by 1.9% through 2029 when factoring in ongoing auto-related duties.
Meanwhile, former BoJ policymaker Makoto Sakurai anticipates the central bank will downgrade its growth outlook in the upcoming July 31 meeting, citing weaker exports and stalled trade negotiations with the U.S. He also noted that the BOJ is likely to hold off on tightening policy until there’s clearer evidence of sustained wage hikes and investment momentum from Japanese firms.

Gold Gains on Weak Dollar, Silver Steady Amid Tight Supply and Overbought Signals
Gold rose to $3,320/oz as the dollar weakened and trade tensions grew. Fed minutes showed a split on rate cuts, with no clear consensus.
Silver holds above $36.60 with strong demand and tight supply. A move toward $37–$40/oz is possible, but overbought signs suggest a near-term pause.
Bitcoin Futures Eye $120K as Bullish Momentum Builds Above $111K
Bitcoin futures are trading above $111K with a bullish setup, supported by strong technical indicators. A breakout above the $112.5K–$113K zone could pave the way toward $120K and beyond.
Crude Slips as Trade Tensions Rise and U.S. Stockpiles Swell
Crude oil prices slid on Thursday as Trump’s escalating tariff threats, now aimed at Brazil with a 50% duty, fuelled global trade fears and demand worries. Fresh levies on copper, semiconductors, and pharma added to the bearish tone.
Adding pressure, the EIA reported a surprise 7.1 million-barrel crude build versus expectations for a draw. Still, a sharp gasoline stock decline and Red Sea disruptions helped limit losses, while a weaker dollar offered some support.
Iron Ore Soars on Reform Hopes and Chinese Growth Signals
Iron ore futures edged higher for the third consecutive session on Thursday. Market optimism was lifted by renewed expectations of supply-side steel curbs and potential economic stimulus from China. Investor confidence was further buoyed after China’s top planning official forecasted the country’s GDP to surpass 140 trillion yuan this year, despite ongoing challenges like deflation and its extended trade dispute with the U.S.
These developments have intensified speculation around possible fresh stimulus announcements at an upcoming high-level policy meeting, analysts at Yongan Futures noted. Meanwhile, a sharp upswing in coal prices, fueled by anticipated supply reform, also lent support to iron ore.
MACRO WATCH
U.S. Apparel Imports from China Sink to 22-Year Low as Tariffs Reshape Global Sourcing
U.S. apparel imports from China dropped to just $556 million in May—the lowest monthly figure since 2003—as sharply higher tariffs push retailers to shift supply chains.
Despite a recent trade deal, U.S. fashion companies continue reducing their China exposure, with audit data showing a 24% year-on-year drop in inspections. Retailers, already bracing for the holiday season, now face added uncertainty as temporary tariff pauses for non-China countries near expiration.
THIS DAY IN HISTORY

REVEALING THE ANSWER FOR PREVIOUS GUESS THE CHART
TODAY’S GUESS THE CHART

What’s a daily market wrap without something to intrigue the reader leading to head scratching moments?
Guess this chart and send in your answer to research@mintfinance.xyz, or attempt the poll below. We will reveal the answer in the next issue.
WHAT’S CAPTIVATING US
The U.S. stock market capitalization-to-GDP ratio has soared to an unprecedented 208%, signaling one of the most stretched valuations in history. Since bottoming in April, the ratio has surged nearly 43 percentage points, eclipsing its previous high of 206% set in February. Remarkably, it has doubled over the past nine years, far exceeding the 142% peak seen during the 2000 Dot-Com Bubble.
Often referred to as the "Buffett Indicator," this metric compares the total value of publicly traded stocks to the size of the economy, and its long-term average is just 85%. While today's ratio reflects optimism around AI, tech-driven productivity, and accommodative policy, it also raises questions about sustainability and frothy valuations.
We are not just witnessing elevated markets, we’re watching history unfold in real time, in a landscape where fundamentals may be taking a back seat to speculative momentum.
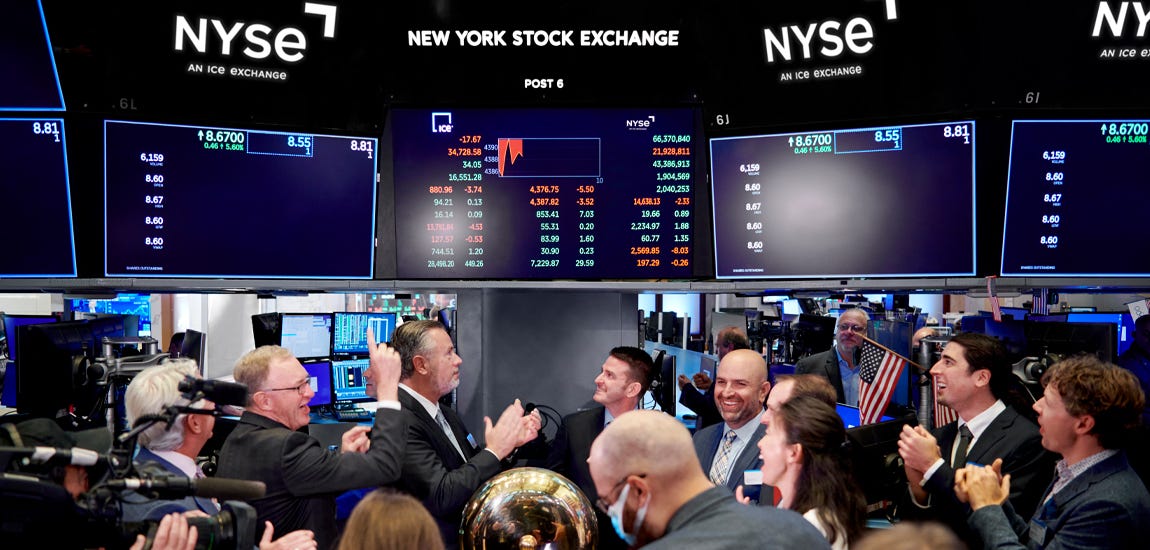
Source: NYSE